PyScript, Aka Python in the Browser
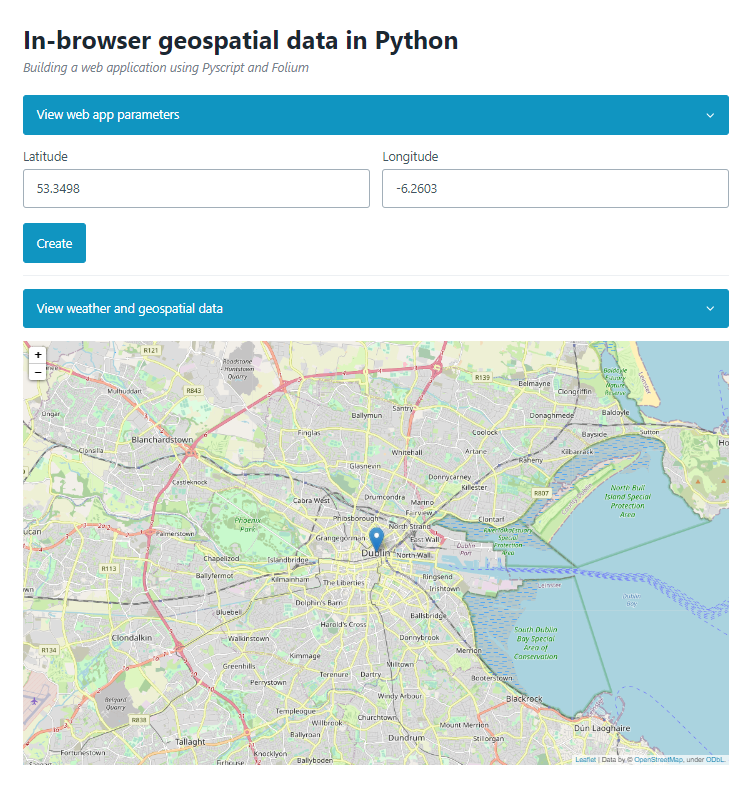
An example of what we’ll be doing in this article

This article is going to be slightly shorter than the ones I usually post on my blog. As PyScript is after all still fairly new, I’ll need to get a bit more familiar with what this library has to offer before I can start working on more interesting projects and share them here. Why write an article about PyScript then if I’m not too comfortable with this framework yet, you might wonder? Well, finally being able to create Python applications in the browser is a massive accomplishment that very few people would have even dreamt of just a few years back and I, like many others, am particularly excited about all the doors that have now opened for Python developers.
That being said, the past couple of years have seen the development of several Python-powered web app frameworks, such as Streamlit or Voila. But though these open-source projects definitely paved the way for a framework like PyScript, they were always very data science focused, which to be fair restricted their use to a somewhat niche audience.
Not quite there yet
Please note that the points below are absolutely not criticisms of the PyScript project, but before setting our expectations too high there are a few limitations and challenges that we simply need to be aware of.
-
Unfortunately, not all the libraries that are indexed on PyPi will run in PyScript, and don’t even think of installing some obscure repositories from GitHub. I have read here and there that there are ways to temporary install libraries in the runtime that PyScript creates, but I must admit that I’m yet to find an easy sway of doing so.
-
PyScript is still an experimental project, and quite naturally its documentation isn’t on par with that of more mature projects. Besides, as of October 2022, even highly popular Q&A websites such as Stack Overflow seem to have very few related discussion threads. Because of this, I’ve had to rely mainly on various YouTube videos to try and learn more about PyScript.
I would particularly recommend the following video (and NeuralNine’s YouTube channel in general):
Getting started
So, how can we start building a simple web app with Pyscript?
I should probably mention before we start that if like me you have very little experience with web development but you still want your web applications to look at least halfway decent, I highly recommend you to take a look at the following minimalist CSS frameworks:
Back to today’s topic, here’s a high-level overview of how to initialize a PyScript runtime in your browser. We’ll start by creating an html file, and by pasting the following lines of code between the <head></head> tags:
<head>

    <link rel="stylesheet" href="https://pyscript.net/alpha/pyscript.css" />

    <script defer src="https://pyscript.net/alpha/pyscript.js"></script>

    <py-env>

      - whichever python library you intend to use

    </py-env>

</head>
Please note that the css file is optional (we’ll be using Pico.css further in this article when creating an interactive map), and that you don’t need to add any Python library between the <py-env></py-env> tags if you don’t intend to use any.
We will of course have to create a pair of <div></div> tags inside the <body> of our page, and assign an id= attribute to it:
<body>

    <div id="viz"></div>

<body>
We can finally write our Python code within a pair of <py-script><\py-script> tags:
<py-script>

    x = "Hey this is Julien!"

    pyscript.write("viz",x)

</py-script>
Upon refreshing our html page, we can see that PyScript is creating a Python runtime in the browser before “printing” “Hey this is Julien!” in the top-left corner of the page:

As you have most likely already noticed, the pyscript.write() method requires two parameters:
- The
id=attribute of the html element where we want to display our Python code - The Python code that we want to run, or a variable that our code is assigned to
Now that wasn’t too complicated!
Scenario 1: I only care about Data Science / Analysis
I have some good news for you: if the only thing that you want to do is perform some data manipulation and visualisation task, or run some basic machine learning model, then pretty much all your favorite libraries are supported by default. We’re talking about Pandas, Matplotlib, SciKit-Learn, but also more advanced frameworks such as TensorFlow, or PyTorch (though I would strongly recommend reading this interesting article first).
On a related note, if you want to get serious with doing data sciency stuff in the browser, I would personally recommend you to learn at least some basics of JavaScript. I’ve discussed on numerous occasions on this blog how great I think the npm ecosystem is when it comes to data manipulation and machine learning packages. More specifically, if like me you’re into natural language processing, you should at least check out packages such as winkNLP, Natural, and Compromise.
Back to PyScript, let’s now see how we can work with the Pandas library, pass a dataset onto a dataframe object and maybe create a simple visualisation. As mentioned earlier, we first need to list the dependencies that we’ll be using:
<head>

    <py-env>

      - pandas

      - matplotlib

      - networkx

    </py-env>

</head>
We want this time to create two pairs of <div></div> tags inside the <body> of our page, and assign a unique id= attribute to them so that we can output both a Pandas dataframe and a Matplotlib chart:
<body>

    <h1><b>Pandas table and plot</b></h1>

    <br>

    <p id="pandas-table"></p>

    <br>

    <p id="pandas-plot"></p>

<body>
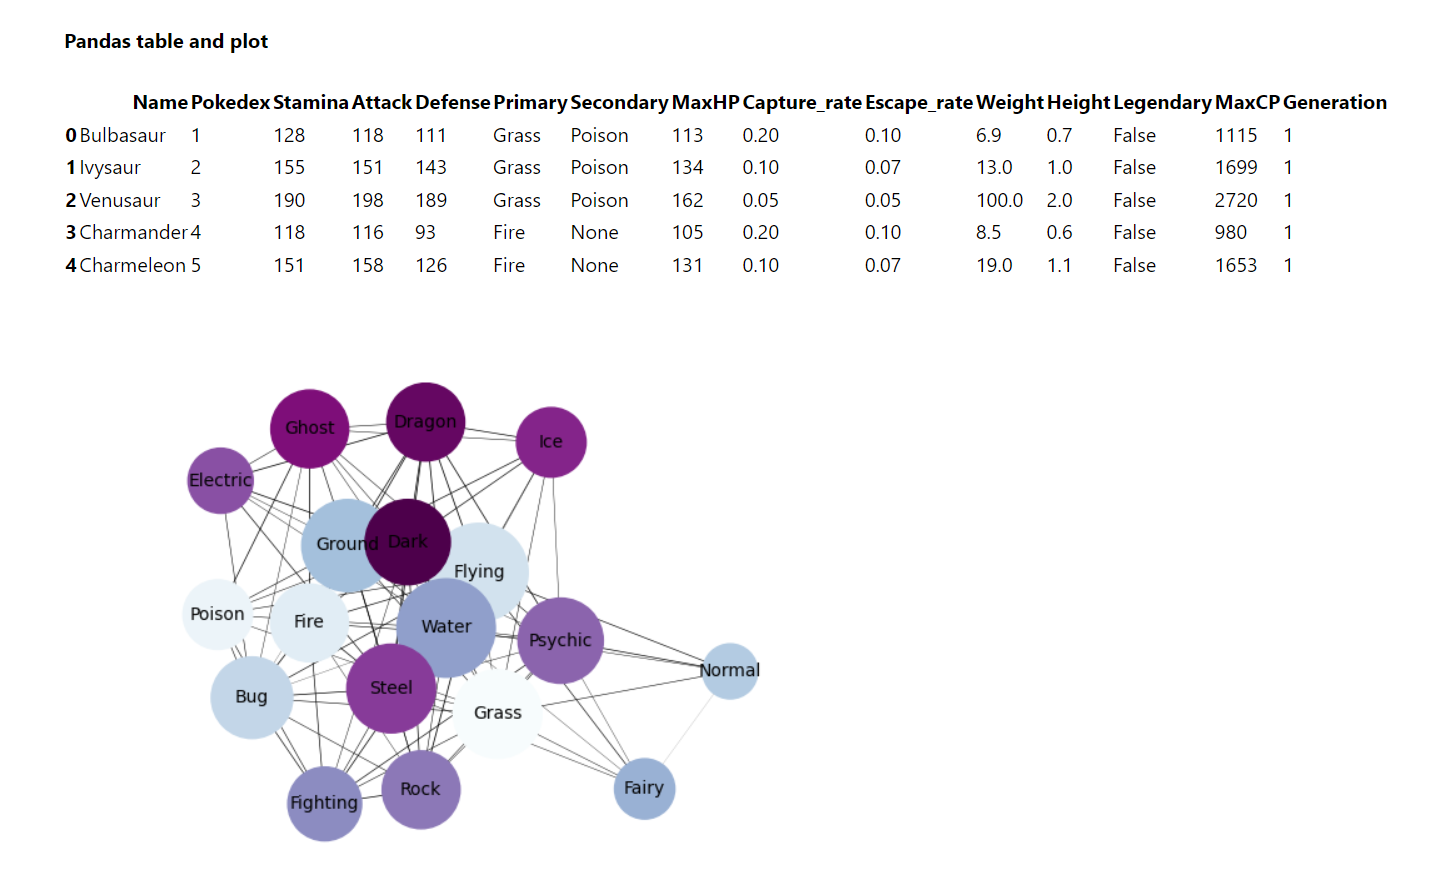
Like before, we write our Python code within a pair of <py-script><\py-script> tags, and the html page should now show the first five rows of the Pandas dataframe as well as a fancy little network graph:
<py-script>

    # libraries

    import pandas as pd

    from matplotlib import pyplot as plt

    import networkx as nx

    from pyodide.http import open_url


    # functions

    def getDataFrame(data):

        df = pd.read_csv(open_url(data))

        return df


    # table

    pokemons = "https://raw.githubusercontent.com/julien-blanchard/dbs/main/pokemon_go.csv"

    df = getDataFrame(pokemons)

    pyscript.write("pandas-table",df.head())


    # network plot

    n = df.filter(["Primary", "Secondary", "Attack", "Defense", "Capture_rate"])

    n = n[n["Secondary"] != "None"]


    def getNetwPlot(data, serie1, serie2, serie3):

      G = nx.from_pandas_edgelist(data, serie1, serie2, edge_attr=True)

      edgelist = nx.to_edgelist(G)


      colors = [i/len(G.nodes) for i in range(len(G.nodes))]


      fig,ax = plt.subplots()

      ax = nx.draw(

          G,

          with_labels=True,

          node_size=[v * 200 for v in dict(G.degree()).values()],

          width=[v[2][serie3] / 500 for v in edgelist],

          font_size=10,

          node_color=colors,

          cmap="BuPu"

      )

      pyscript.write("pandas-plot",fig)


    getNetwPlot(n, "Primary", "Secondary", "Attack")

</py-script>

That’s pretty neat, right!
Scenario 2: I actually don’t mind some basic web development
Well then, why don’t we start with a quick refresher on why we should use event listeners to add some interactivity to our html page?
The official Mozilla website highly recommends using event listeners instead of the old-fashioned onclick= html attribute, as they (amongst many other things):
"..allow adding more than one handler for an event. This is particularly useful for libraries, JavaScript modules, or any other kind of code that needs to work well with other libraries or extensions."
Right, but how does that work? Say you have a <button> named “first” and an empty <p> tag named “second” on your page:
<button id="first">Click me</button>

<p id="second"></p>
What you want is that upon clicking the button, your <p> tag shows the word “pizza”. Here’s how you can do it, using an event listener:
let a = document.getElementById("first");

let b = document.getElementById("second");


const getCompleted = () => {

   b.innerHTML = "pizza";

 }


a.addEventListener("click", getCompleted);
We could now, if we wanted to, add more events to the above code, like for instance getting the text to change to “hamburger” when a user simply places their mouse cursor over the button, by changing "click" to "mouseover".
Now that this is clear, why don’t we create a small website that takes the geographical coordinates of any given location on earth, and renders that location on an interactive map?
Note of caution: what we’re going to do now actually makes very little sense from a productivity / efficiency standpoint. We’d be better off directly using the Leaflet package for JavaScript (actually, the Python library that we’re going to use is built upon Leaflet).
What we’ll need for this is the Pico.css framework and a Python library named Folium:
<head>

    <link rel="stylesheet" href="https://unpkg.com/@picocss/pico@latest/css/pico.min.css">

    <script defer src="https://pyscript.net/alpha/pyscript.js"></script>

    <py-env>

      - folium

    </py-env>

</head>
Now, remember when I mentioned earlier that importing Python libraries could be a bit of a hit-and-miss? My initial plan was to create a website that simply requires a user to enter the actual name of a location (for instance “Paris”), and then use the Geopy library to obtain the coordinates for that place. Now, I know that there are tons of JavaScript packages that will do this for us, but I’m trying to stick to Python as much as possible here.
If you’re interested in using Geopy, the code that we would have used would probably have looked a bit like this:
from geopy.geocoders import Nominatim


def getCoordinates(city_name):

    geolocator = Nominatim(user_agent="MyApp")

    location = geolocator.geocode(city_name)

    return [location.latitude,location.longitude]
Our next step is to create a very simple website with some drop-down elements and a couple of <input> forms:
<body>

    <main class="container">

      <div class="headings">

        <h1>In-browser geospatial data in Python</h1>

        <h3> <i>Building a web application using Pyscript and Folium</i> </h3>

      </div>

      <div>

        <details>

          <summary role="button">View web app parameters</summary>

          <div class="grid">

            <label>

              Latitude

              <input type="text" id="lat" class="outline" placeholder="" required>

            </label>

            <label>

              Longitude

              <input type="text" id="lon" class="outline" placeholder="" required>

            </label>

          </div>

          <a href="#" role="button" id="userinput">Create</a>

        </details>

      </div>

      <details>

        <summary role="button">View weather and geospatial data</summary>

        <div class="container">

          <div id="geomap"></div>

        </div>

      </details>

    </main>

</body>

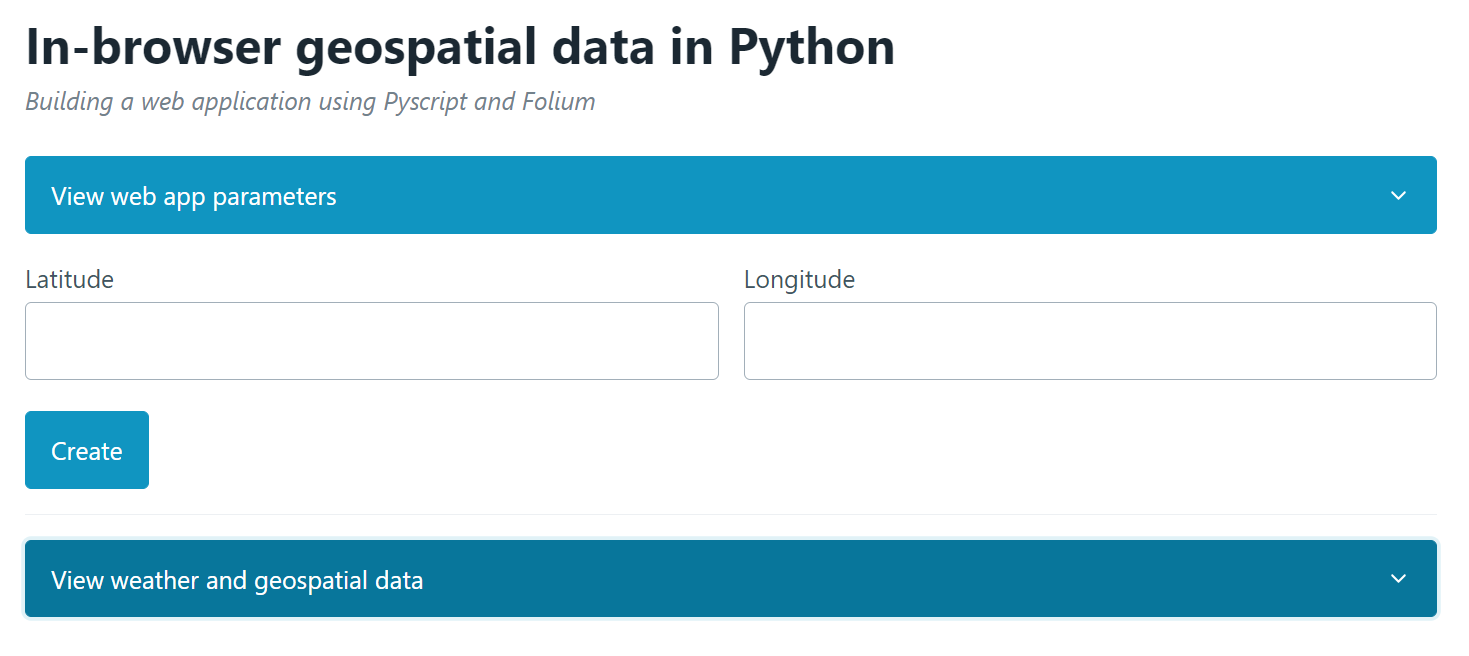
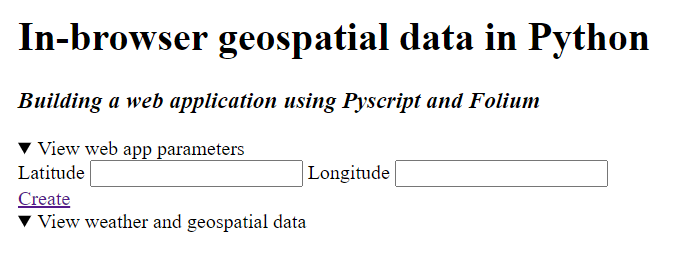
Though we probably won’t win any web design award for our website, using Pico.css has at least made it look slightly better than what we would have gotten using vanilla html:

Alright, all that’s left for us to do is:
- Write the Python code that creates a Folium map from a given set of coordinates
- Set an event listener to retrieve any set of coordinates entered by the user and pass them as parameters into our Python function
<py-script>

    # libraries

    import folium

    from js import document, Element

    from pyodide import create_proxy


    def getMap(event):

      document.getElementById("geomap").innerHTML = ""

      input_lat = document.getElementById("lat").value

      input_long = document.getElementById("lon").value

      latitude = float(input_lat)

      longitude = float(input_long)

      m = folium.Map(

          location=[latitude,longitude],

          tiles="OpenStreetMap",

          zoom_start=12

         )

      folium.Marker(

          [latitude,longitude],

          popup=folium.Popup(max_width=650)

          ).add_to(m)

      pyscript.write("geomap",m)


    button = document.getElementById("userinput")

    button.addEventListener("click", create_proxy(getMap))

</py-script>
As you might have noticed, we made a slight change as to how the event listeners work in our vanilla JavaScript code above: we embedded the getMap() function into another function named create_proxy(), that we imported from the pyodide library (actually, PyScript is partly built on top of Pyodide).
Please also note that we will need to reset the "geomap" <div></div> tags every time a user calls the getMap() function, otherwise newly created maps will simply keep piling up on top of each other. To avoid that, we simply clear the <div> element by writing document.getElementById("geomap").innerHTML = "".

If we type in the latitude and longitude for Dublin, Ireland, we get this pretty sweet looking map!