Visualizing Text Data Hierarchy With Word Trees
An example of what we’ll be doing in this article
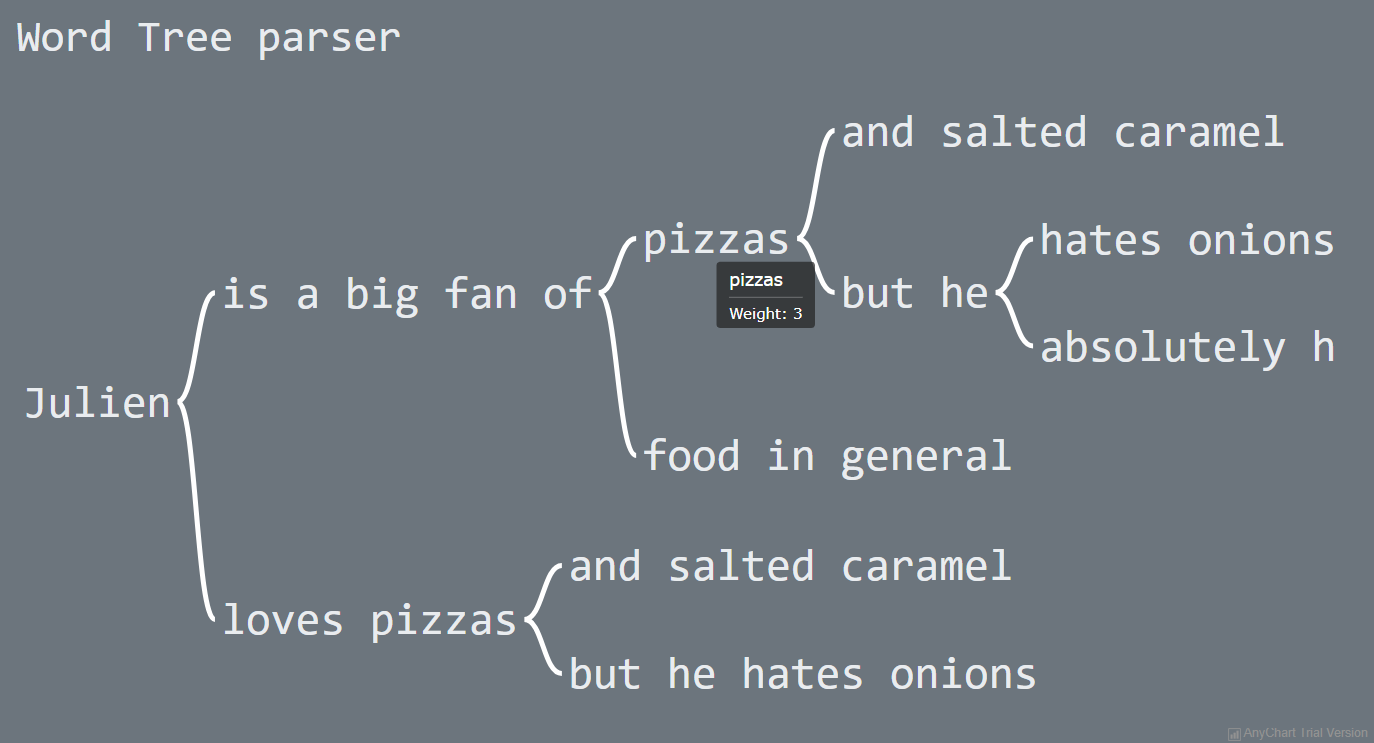
Over the past few weeks, I have been looking for a quick and effective way of representing the structural differences within a set of similar-looking short sentences.
To provide a bit of context, as we approached the end of 2022, my workmates and I got heavily involved in a planning phase for the new year to start. More specifically, we were asked to write a set of objectives and key results that would help drive a common strategy across our supported programs and pillars over the months to come.
And as expected, each and every one of us ended up leaving comments for every subtle change made to the couple of sentences that had initially been dropped into a shared document. As the comments started piling up, it quickly became quite tedious to follow and understand the slight modifications that were being made to our original set of objectives and key results.
As I started exploring what we could have done to better capture and visualise these changes, I recently found a way to display text data in a hierarchical way that I thought would be worth sharing.
Spot the differences
Let’s start by creating some textual data that we’ll be using throughout this article as a basis for our word tree charts:
"Julien is a big fan of pizzas and salted caramel"

"Julien loves pizzas and salted caramel"

"Julien is a big fan of food in general"

"Julien loves pizzas but he hates onions"

"Julien is a big fan of pizzas but he hates onions"

"Julien is a big fan of pizzas but he absolutely hates onions"

"Julien is a big fan of pizzas"

"Julien loves pizzas"
What we can immediatelly tell is that though the above sentences look quite similar, they are yet slightly different. The fact that we’re only dealing with a handful of strings probably helps us visualise their syntaxic nuances.
But I’m wondering what would happen if we had 50 times as many sentences. Would we still be able to easily spot how different they are?
Now, a sensible approach to that dimensionality problem would be to rely on eiher of the following string distance metrics:
- The Damerau-Levenshtein distance, or something related like the Guth distance
- The Dice coefficient
- The Jaccard index
- The Jaro-Winkler distance
- etc..
We could loop through our corpus, compute a distance score across each sentence, store these values into a multi-dimensional array, and then visualize that array through a combination of correlation plots. Our code would probably would a bit like that:
import Levenshtein as lev

import pandas as pd


corpus = [

    "Julien is a big fan of pizzas and salted caramel",

    "Julien loves pizzas and salted caramel",

    "Julien is a big fan of food in general",

    "Julien loves pizzas but he hates onions",

    "Julien is a big fan of pizzas but he hates onions",

    "Julien is a big fan of pizzas but he absolutely hates onions",

    "Julien is a big fan of pizzas",

    "Julien loves pizzas",

]


def getMatrix(data):

    m = {}

    ind = 1

    for d in data:

        m[f"Sentence {ind}"] = [lev.ratio(d,sent) for sent in data]

        ind+=1

    return m


def getDataFrame(data):

    distances = getMatrix(data)

    sentences = {"Sentences": [f"Sentence {i+1}" for i in range(len(data))]}

    datafr = pd.concat([pd.DataFrame(sentences),pd.DataFrame(distances)], axis=1)

    return datafr.style.background_gradient(cmap="Blues")


df = getDataFrame(corpus)

df
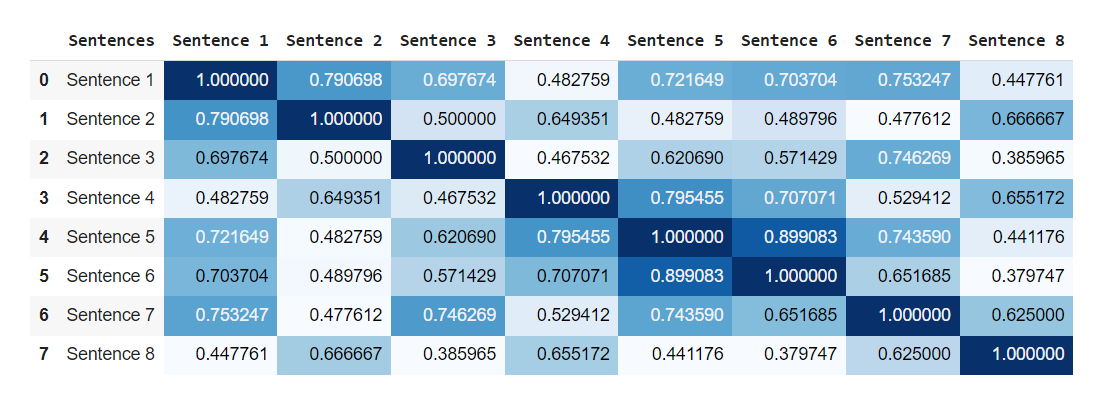
But that’s not what we’re going to do today! Instead, we’re going to focus on how to represent multiple parallel sequences of terms through a simple hierarchical decision tree.
Oh no, not JavaScript again!
Truth be told, I initially went for a Python-based approach, but none of the popular data visualisation libraries (Matplotlib, Plotly, Bokeh) really seemed to provide the type of chart that I was looking for. A rapid Google search returned an obscure package named wordtree, but I realised that it hadn’t been updated for over 2 years and required having Graphviz installed anyway.
Yes, nltk has a module named Draw that can be used to display a hierarchical tree. However, it is built on the back of Matplotlib and can’t provide any interactivity.
I plead guilty to being a bit of a JavaScript fanboy, but I genuinely think that the npm ecosystem offers some fantastic data visualization packages. I’ve personally always been amazed to see what some talented programmers can achieve using libraries like D3.js or Airbnb’s Visx.
Now if you have been following my website, you probably know that I personally am a big fan of another library, named Anychart. Feel free to check my articles on network graphs and treemap charts if you want to know more!
As we’ll be visualising our word tree directly in the browser, let’s start by creating a simple html file and importing the necessary packages / files:
<head>

    <script src="https://cdn.anychart.com/releases/8.11.0/js/anychart-core.min.js"></script>

    <script src="https://cdn.anychart.com/releases/8.11.0/js/anychart-bundle.min.js"></script>

    <link rel="stylesheet" href="style.css">

</head>
Still within this html file, We’ll also need a couple of nested <div> elements:
<body>

    <div class="container">

        <div id="viz"></div>

    </div>

</body>
As well as a simple css file, just so we’re sure our chart gets rendered properly:
.container {

    display: flex;

  }

  html, body, #viz {

    margin: 0px;

    width: 1100px;

    height: 600px;

  }
The fun part starts now! If we head over to Anychart’s official documentation, we’ll see that each of our sentences needs to be nested within its own individual array:
let corpus = [

    ["Julien is a big fan of pizzas and salted caramel"],

    ["Julien loves pizzas and salted caramel"],

    ["Julien is a big fan of food in general"],

    ["Julien loves pizzas but he hates onions"],

    ["Julien is a big fan of pizzas but he hates onions"],

    ["Julien is a big fan of pizzas but he absolutely hates onions"],

    ["Julien is a big fan of pizzas"],

    ["Julien loves pizzas"]

]
We’re now only three lines of JavaScript code away from outputting our very first word tree chart:
let chart = anychart.wordtree(corpus);

chart.container("viz");

chart.draw()
And we’re done! Let’s open our html page and see what we got.
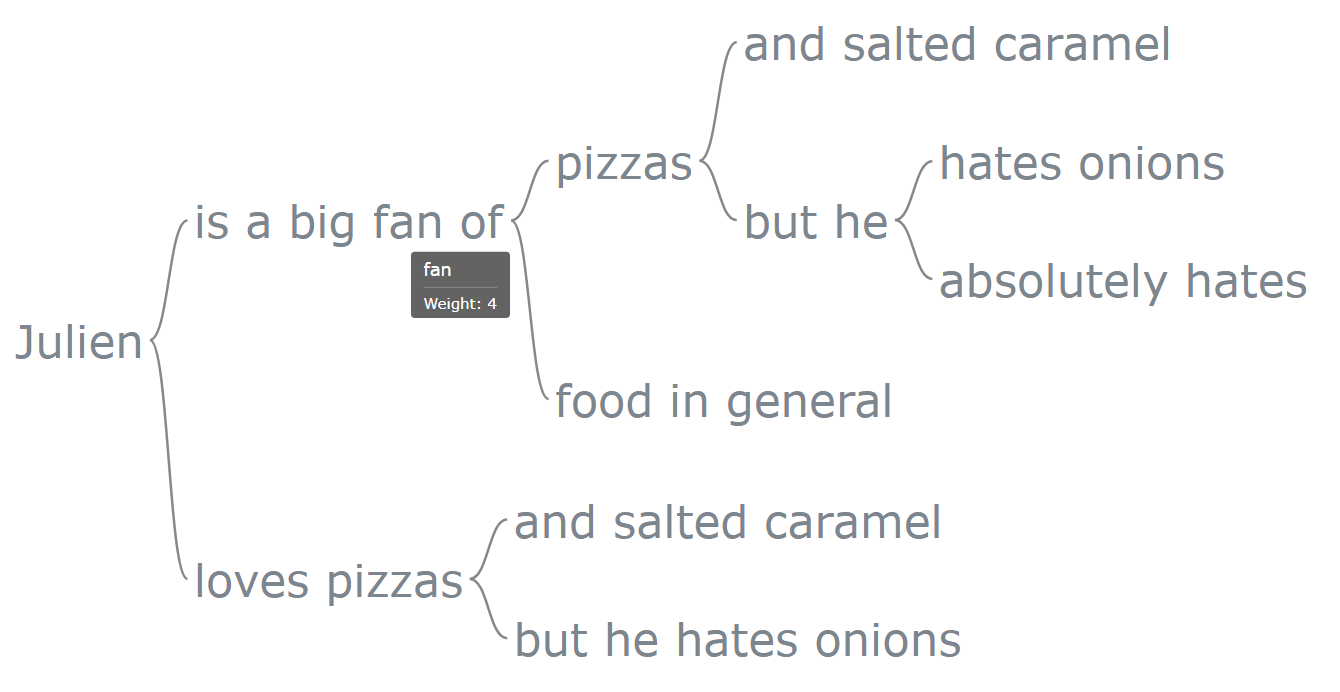
You’ll have noticed that we can hover over each term and get their corresponding weight, which is pretty neat! We should also probably clean up our code and add more parameters to our chart object:
const getWordTree = (data,chart_title) => {

    let chart = anychart.wordtree(data);

    let title = chart.title();

    title.text(chart_title);

    title.enabled(true);

    title.fontSize(35);

    title.align("left");

    title.fontColor("#e9ecef")

    title.fontFamily("helvetica");

    title.fontStyle("italic");

    chart.container("viz");

    chart.fontFamily("Helvetica");

    chart.fontColor("#e9ecef")

    let connectors = chart.connectors();

    connectors.stroke("4 #FFFFFF");

    chart.background().fill("#6c757d");

    chart.draw();

}


getWordTree(corpus,"Word Tree parser");

A tree of tags
Our first attempt wasn’t too bad, but as the sentences within our corpus array start getting more complicated, the readability of our word tree chart is going to rapidly deteriorate. Besides, working with unlemmatized terms might not be a clever approach, as terms with a similar root will lead to children trees being created.
Why don’t we use a part-of-speech tagger to represent the structure of our corpus array instead? Replacing the terms within each sentence by their corresponding PENN treebank tag might solve our problems! Again, the npm ecosystem features somes great NLP packages, and we’ll be using a library named Compromise.js. We won’t be spending too much time today going through its main features, as I wrote an article entirely dedicated to in-browser text processing with Compromise.js a little while ago.
Long story short, we’ll first need to add this pair of <script></script> tags of our html file:
<script src="https://unpkg.com/compromise"></script>
If you’re coming from Python and have already used spaCy, the following function should then look pretty familiar:
const getPOSTags = (text) => {

  let result = new Array();

  let doc = nlp(text);

  doc.compute("penn");

  let data = doc.json()

  for (let d in data) {

      console.log(d, data[d]);

  }

}


getPOSTags("Julien is a big fan of pizzas and salted caramel.");
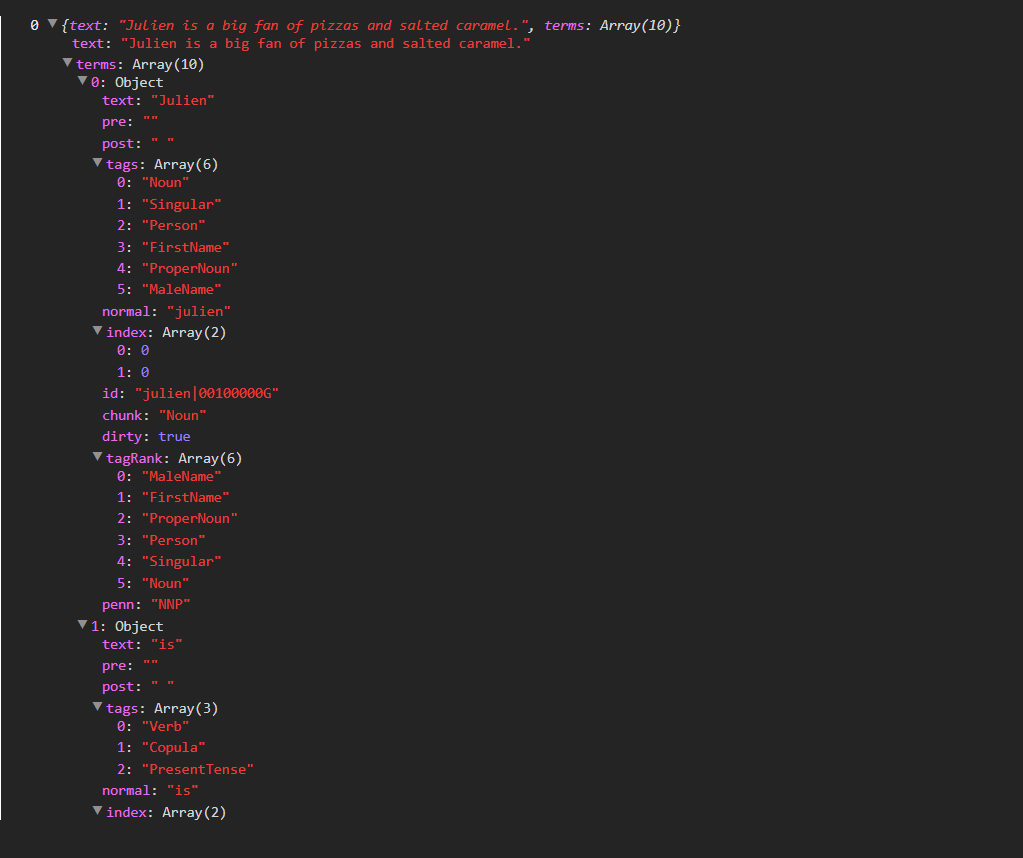
Right, so Compromise.js has generated an object that quite frankly contains way too much information for what we’re trying to do today. What we should do now is create a new array named corpus_tags and simply throw our part-of-speech tags into it. Here’s our modified getPOSTags() function:
let corpus_tags = new Array();


const getPOSTags = (text) => {

  let result = new Array();

  let doc = nlp(text);

  doc.compute("penn");

  let data = doc.json()

  for (let d in data) {

    for (let t in data[d].terms) {

      result.push(data[d].terms[t].penn);

    }

  }

  return result.join(" ");

}


corpus.forEach(

  c => corpus_tags.push([getPOSTags(c)])

)


corpus_tags.forEach(

  c => console.log(c)

)
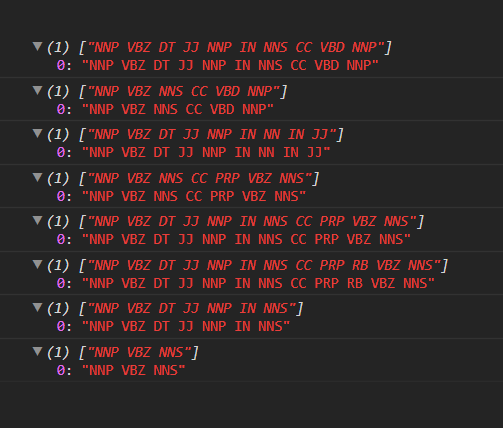
That’s much better! All that’s left to do at this point, is call the getWordTree() function that we created earlier, this time using our new corpus_tags array:
getWordTree("corpus_tags","POS Tags Tree parser");
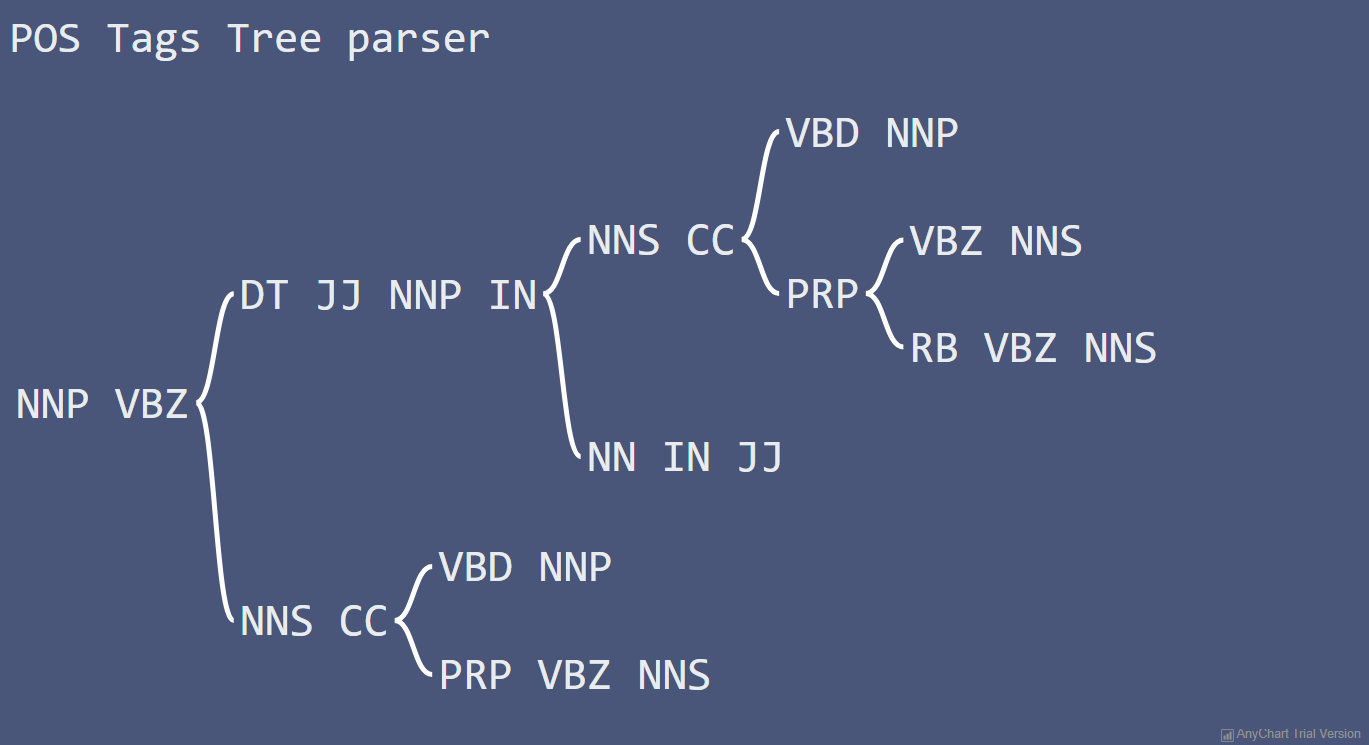
As you have probably noticed, I have made some changes to both the background and font colours. But all the other parameters were left untouched.